
Local elk numbers in line with average
June 9, 2022
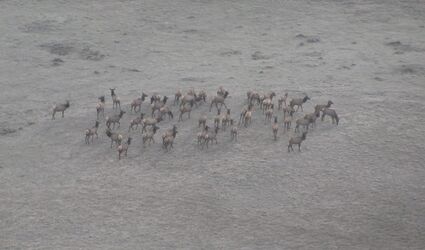
FWP Photo
A heard of elk grazes this spring. Montana Fish, Wildlife & Parks conducted surveys of wildlife in April.
Montana Fish, Wildlife & Parks staff (FWP) conducted spring surveys and the number of elk in the valley is in the 10-year average. Wildlife Biologist Mike Ebinger said staff surveyed elk herds in hunting districts 121 and 123 by helicopter over eight days in April.
"Spring conditions were cold and snow levels were lower than normal," Ebinger said. "Late green-up and low snow levels caused the delay of the western HD-121 flights one week." FWP flew 912 miles in the two weeks of surveys.
The total number of elk counted by FWP this spring in HD-121 was 1,497. The average count for the last 10 years is 1,520, with 2012 and 2019 have the lowest counts of 1,418 and 2016 the highest count at 1,652. Ebinger said the objective is to have 1,355 elk in HD-121. In HD-123, FWP counted 311 this spring, with the target being 365. "We believe the count may be biased low due to the unseasonable cold temperatures and hard frost during the morning flight in the Cherry-Creek-Wilkes Creek-Dry Creek area," Ebinger noted. "Elk were bedded down in thick timber and not out in open fields where they are typically observed, making detection difficult." He noted it was 18 degrees on April 16 when FWP conducted that flight.

"We saw quite a number of elk in the back country," Ebinger said, "especially bulls.
"While some bulls, particularly yearling bulls, are observed in the valley bottoms, most bulls are observed in the mountains in heavily timbered areas," Ebinger stead. "Given the difficulty in sightability in heavy timber, counts of bulls underrepresent the true number in the population. However, in HD-121, FWP counted an average of 12.4 bulls per 100 calves, up slightly from the five-year average of 11.1. In HD-123, FWP counted 19.6 bulls per 100 cows, also up from the five-year average of 11.0.
Ebinger shared that the recruitment index, which measures how many calves survive their first year, was up in both hunting districts. The recruitment index counts the number of calves per 100 cows. In HD-121, the recruitment index was 23.9 this year, up from the 2019 five-year average of 20.4. In HD-123, the recruitment index is 26.6 this year, compared with the 2019 five-year average of 16.5. In HD-123, calf recruitment averaged 26.6 calves per 100 cows, up from the five-year average of 16.5. Ebinger said it's encouraging to see the calf recruitment up.
The last full count by FWP was in 2019 due to the pandemic. Ebinger said the counts are important for trends and season setting purposes, and are used along with phone surveys after hunting season to keep track of populations.
Reader Comments(0)